Process exporter in Prometheus
I wrote the previous post about monitoring my machine using Prometheus thinking that I can monitor it the way I can using task manager in Windows or activity monitor in MacOS. With the help of node exporter I can monitor the cpu usage, memory usage, or network, but I can't see what processes use the most cpu or memory. Turns out I need another exporter if I want that information, the process exporter.
This exporter itself is not part of official prometheus exporters. The good thing is it's listed in Exporters and integrations page on Prometheus documentation. It's mentioned in that page that this exporter is one of 3rd party exporters and Prometheus doesn't vet this kind of exporters for best practices. Still the fact that this exporter is listed in the official Prometheus documentations means that this option is probably my best option right now.
The bad news is the process exporter can only run on Linux machines. I tried
cloning the repo and building it locally but the binary failed to run because
it turns out the exporter relies on getting the information from /proc.
% ./process-exporter
2024/07/21 15:13:58 Reading metrics from /proc for procnames: []
2024/07/21 15:13:58 Error initializing: could not read "/proc": stat /proc: no such file or directory
Nothing I can do about that. So I decided to run the exporter on my Hetzner
Linux node. So I ssh into the node, download the release for linux amd64, and
extract the tar file. I cd into the directory extracted and then create
a new file, config.yaml, and paste the simplest config, as mentioned in
the project's GitHub readme file.
process_names:
  - name: "{{ .Comm }}"
    cmdline:
    - '.+'
Next, I run the exporter with the following command.
$ ./process-exporter --config.path config.yamlNow, the exporter is running and I can open the metrics page from port 9256. Scrolling down the page I found the metrics for cpu usage for each processes.
# HELP namedprocess_namegroup_cpu_seconds_total Cpu user usage in seconds
# TYPE namedprocess_namegroup_cpu_seconds_total counter
namedprocess_namegroup_cpu_seconds_total{groupname="(sd-pam)",mode="system"} 0
namedprocess_namegroup_cpu_seconds_total{groupname="(sd-pam)",mode="user"} 0
namedprocess_namegroup_cpu_seconds_total{groupname="agetty",mode="system"} 0
namedprocess_namegroup_cpu_seconds_total{groupname="agetty",mode="user"} 0
namedprocess_namegroup_cpu_seconds_total{groupname="atd",mode="system"} 0
namedprocess_namegroup_cpu_seconds_total{groupname="atd",mode="user"} 0
namedprocess_namegroup_cpu_seconds_total{groupname="bash",mode="system"} 0
namedprocess_namegroup_cpu_seconds_total{groupname="bash",mode="user"} 0
namedprocess_namegroup_cpu_seconds_total{groupname="containerd",mode="system"} 0.35999999999989996
namedprocess_namegroup_cpu_seconds_total{groupname="containerd",mode="user"} 0.43000000000006366
namedprocess_namegroup_cpu_seconds_total{groupname="cron",mode="system"} 0
namedprocess_namegroup_cpu_seconds_total{groupname="cron",mode="user"} 0
namedprocess_namegroup_cpu_seconds_total{groupname="dbus-daemon",mode="system"} 0
namedprocess_namegroup_cpu_seconds_total{groupname="dbus-daemon",mode="user"} 0
namedprocess_namegroup_cpu_seconds_total{groupname="dockerd",mode="system"} 0.00999999999999801
namedprocess_namegroup_cpu_seconds_total{groupname="dockerd",mode="user"} 0.060000000000002274
namedprocess_namegroup_cpu_seconds_total{groupname="multipathd",mode="system"} 0.04999999999999716
namedprocess_namegroup_cpu_seconds_total{groupname="multipathd",mode="user"} 0.03999999999999204
In [the process exporter's readme], the following information is mentioned.
cpu_seconds_total counter
CPU usage based on /proc/[pid]/stat fields utime(14) and stime(15) i.e. user and system time. This is similar to the node_exporter's node_cpu_seconds_total.
That last part. It means I can use this metric to the track the cpu usage of each process.
For memory usage, the same readme file lists memory_bytes metrics. This metrics
has memtype labels, which can be 1 of 3 values: resident, virtual, and
swapped. I think what I need for the actual RAM used by a process is the
one with resident as memtype, but I am not quite sure. But let's use it
for now.
Next, I want to graph the cpu and memory usage of my server. I have prometheus
running in my local machine, so I just need to add my Hetzner server as the
prometheus target. I add another item under scraper_configs inside my
prometheus.yml file.
scrape_configs:
  - job_name: "prome"
    static_configs:
      - targets: ["localhost:9090"]
  - job_name: "node_exporter"
    static_configs:
      - targets: ["localhost:9100"]
  - job_name: "process_exporter"
    static_configs:
      - targets: ["<my-linux-server-ip>:9256"]
I re-run the prometheus binary, then I can see now that my linux server has been added as one of the targets.
Now to test whether the process exporter can really help me to track the cpu usage of a process inside my server, I create a simple nodejs app that access http request on port 3000, and everytime someone requested it, it will wait for 5 seconds and then return Hello, world.
const express = require('express')
const app = express()
const {execSync} = require('child_process');
const port = 3000

app.get('/', (req, res) => {
  execSync('sleep 5')
  res.send('Hello World!')
})

app.listen(port, "0.0.0.0", () => {
  console.log(`Example app listening on port ${port}`)
})
This is the query that I use to get the cpu times used by the node process.
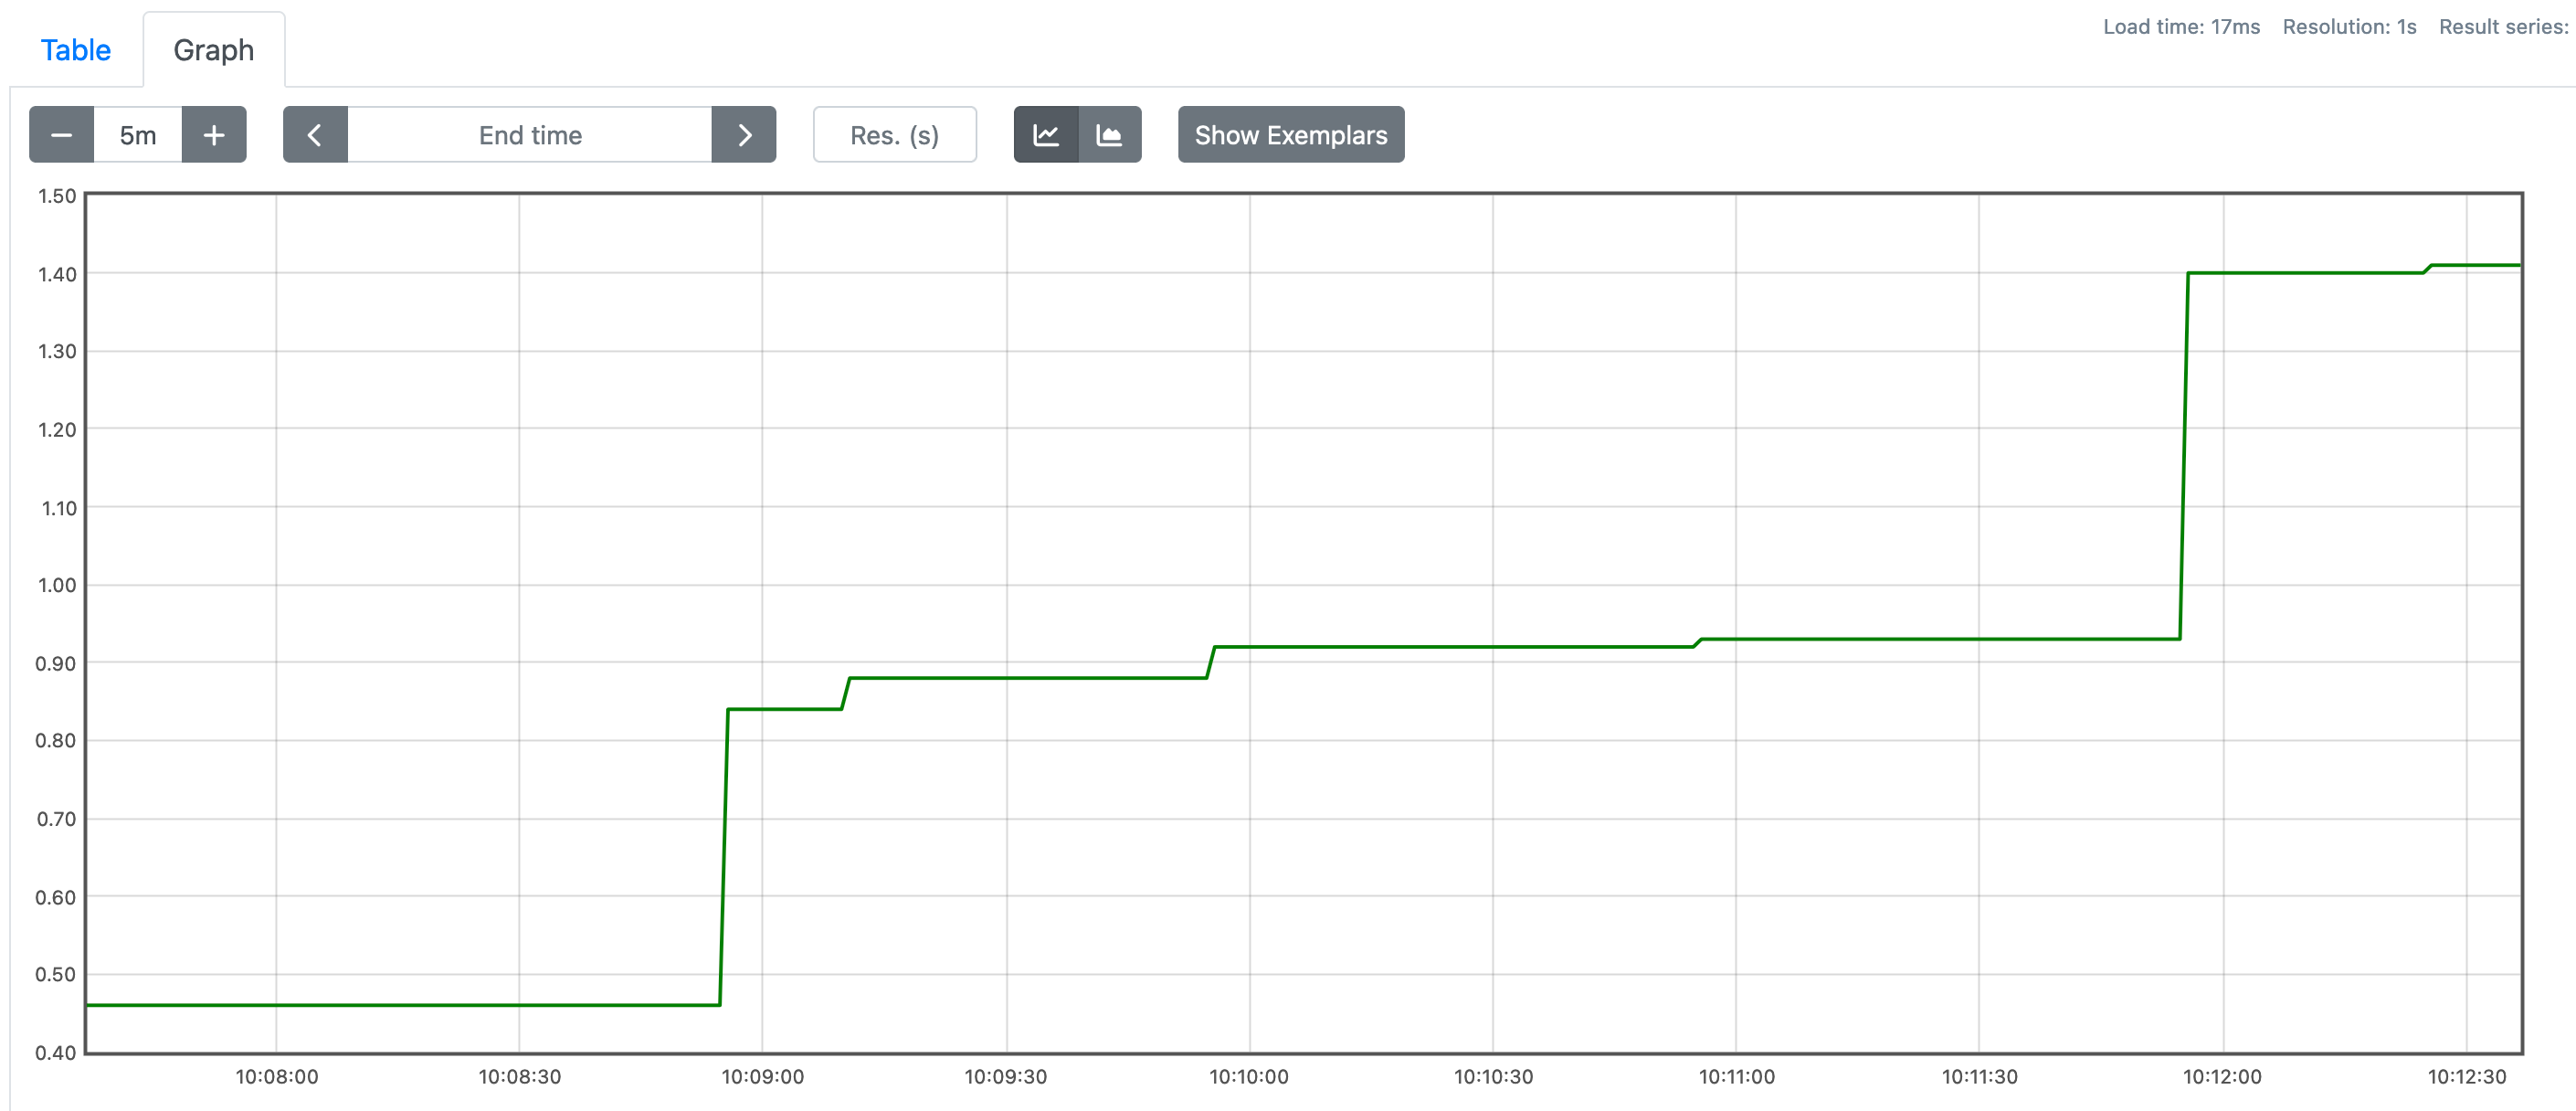
sum(namedprocess_namegroup_cpu_seconds_total{groupname="node"})This is the graph that I get.

The cpu time used increases every time I make a request to my app since it execute sleep and the command is executed in synchronous mode.
I use the following query to get a better number represent the cpu usage of the node app.
sum(rate(namedprocess_namegroup_cpu_seconds_total{groupname="node"}[30s])) by (groupname)Let's break it down. The most inner part of the above query is this.
namedprocess_namegroup_cpu_seconds_totalThis is the metrics to get the cpu seconds used by all the processes running. To
narrow it down to the node app process, I use the groupname label with node
value.
namedprocess_namegroup_cpu_seconds_total{groupname="node"}Now, I have two lines in my graph. The series section below the graph show the important information.

Those two series are almost identical except for the mode label value. So
basically the user mode is the time used by CPU to execute code in user space
and the system mode is the time used in kernel space.
Next, I expand the query to be:
rate(namedprocess_namegroup_cpu_seconds_total{groupname="node"}[30s])So the rate function is essentially telling prometheus to calculate how much
a counter metrics, like namedprocess_namegroup_cpu_seconds_total, changes
over the interval, which in this case is 30 seconds (the number in the bracket).
Basically what prometheus does is get the value of the metrics at the start
of the duration of the interval, let's call it value A, and then get the value
30 seconds after that, let's call it value B, and then substract A from B and
divide it by 30.
Let's put it this way. If a process in our server, let's call it process X, has used 1000 seconds of cpu time at the start of the duration, and after 30 seconds it uses 1020 seconds of cpu time, it means process X uses 20 seconds out of 30 seconds cpu time available in that 30-second duration. With that we can conclude that it uses 2/3 of cpu times, or 66.67% cpu time, in that duration. If the process X uses let's say 30 seconds of 30 seconds available, it means it uses 100% of cpu time available. We can also say that it uses the whole cpu for itself in that duration.
From the latest query, I still have two series. One for user mode and one for
system mode. To combine them, I use sum function.
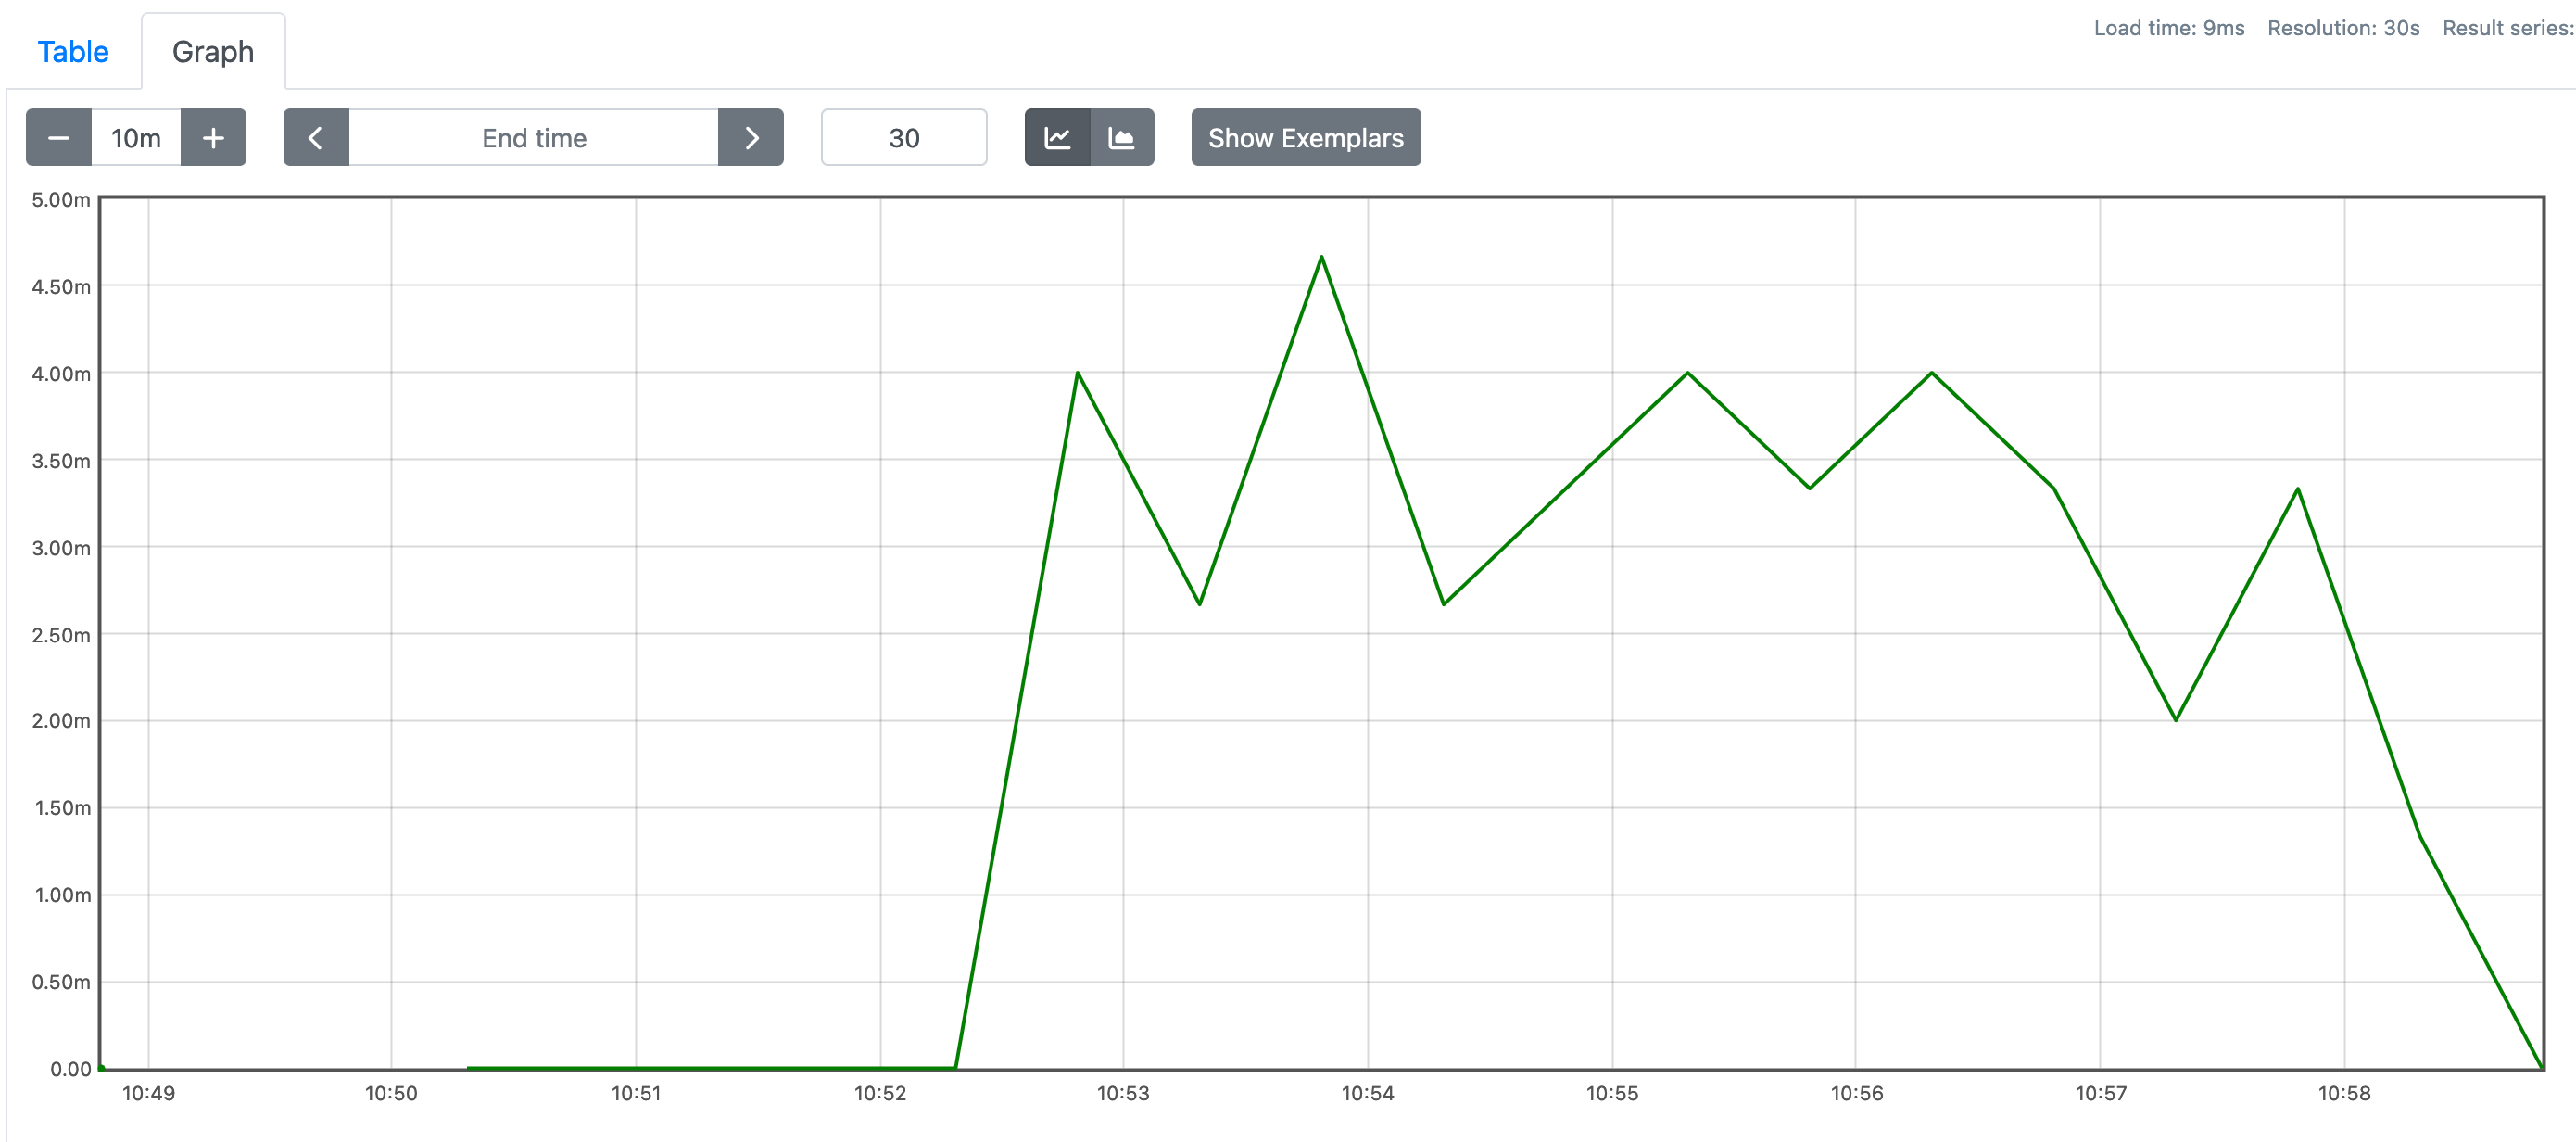
sum(rate(namedprocess_namegroup_cpu_seconds_total{groupname="node"}[30s])) by (groupname)As the final experiment, I will use hey, a command line tools to load test http servers. I want to use how it effects the cpu usage of my simple node app.
I run the following command to load test my node app for 1 minute.
$ hey -z 1m http://<my-node-ip>:3000
Sure enough, the cpu usage for the node app increases while the load test is
in progress. But it's still quite small. Probably because the app itself
only calls sleep while responding to the request but doing nothing else.
One thing that I don't understand though after hey finished sending request,
the cpu usage itself not instantly decreased to zero. It took more than 3
minutes to go down. I don't know why. Maybe that's just how node works. Or maybe
not. Or maybe my prometheus query is wrong? I don't know.
Next time, just out of curiosity, I might try with simple golang app or python. Just for the sake of trying it out.
- ← Previous
Replacing brew with nix - Next →
Back to eleventy-base-blog starter project