Prometheus' Metrics
Continuing from the previous post, let's check on the metrics provided by prometheus.
The metrics
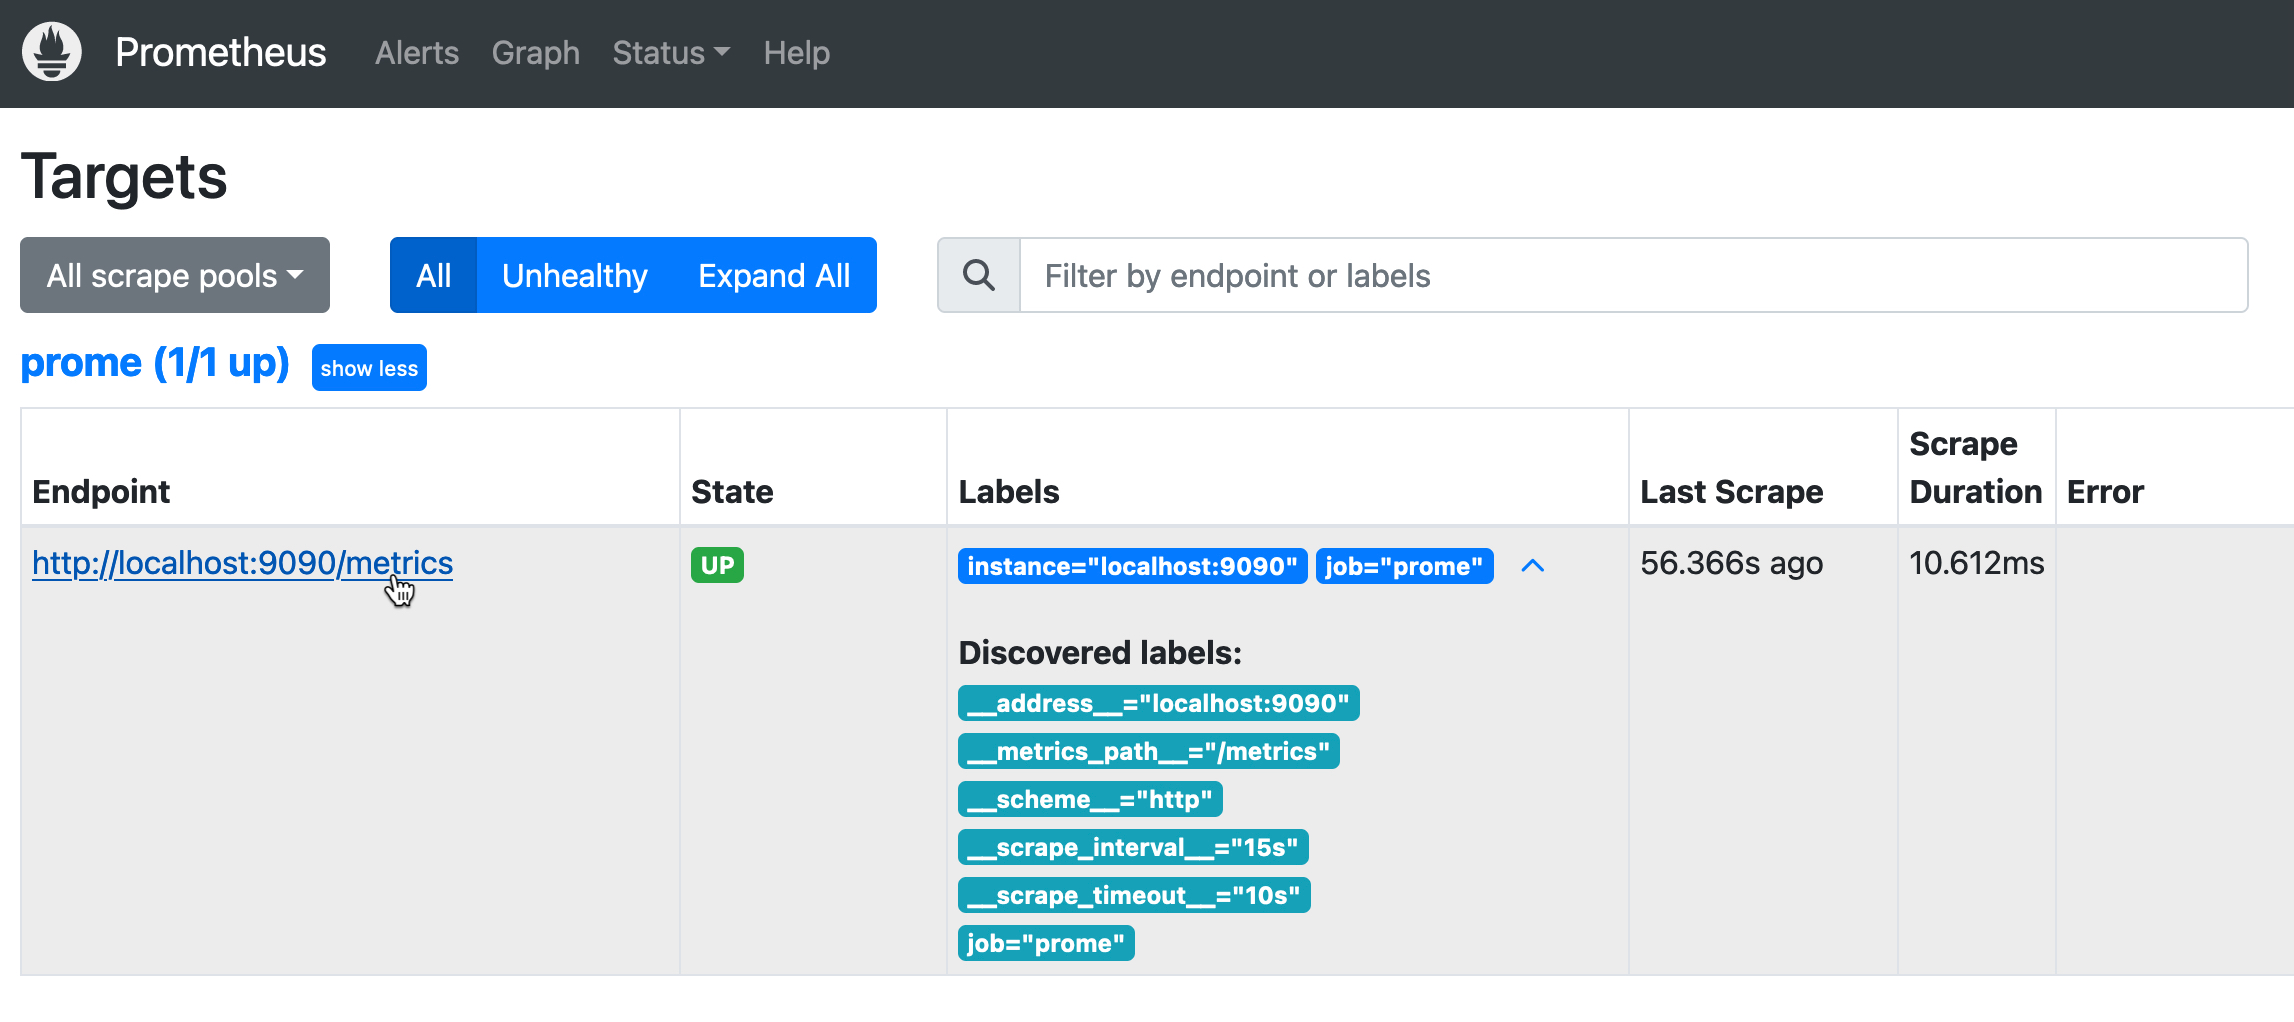
If you go back to Prometheus UI on the targets page, there is one target currently watched by prometheus. The endpoint for that target is http://localhost:9090/metrics. So by default when you run prometheus, it will also serve its own metrics at port 9090.
Click the link on the targets page, you will see the metrics.


Each line in that page is a metric, except for line started with a #, which are the documentation for the metric that comes after those lines. For example the very first metric called go_gc_cycles_automatic_gc_cycles_total. In the page it's shown like this.
# HELP go_gc_cycles_automatic_gc_cycles_total Count of completed GC cycles generated by the Go runtime.
# TYPE go_gc_cycles_automatic_gc_cycles_total counter
go_gc_cycles_automatic_gc_cycles_total 16
The first line, which is started with # HELP, is the description of the metric.
The second line, which is started with # TYPE, is the type of the metric,
counter. It is one of metric types in prometheus. The third line is the
metric and its value. Notice that it has no unit, only the value.
The labels
While reading the metrics you might notice that some metrics have curly braces with some kind of key-value pair in it. Like,
go_gc_heap_allocs_by_size_bytes_bucket{le="8.999999999999998"} 19461
go_gc_heap_allocs_by_size_bytes_bucket{le="24.999999999999996"} 130267
go_gc_heap_allocs_by_size_bytes_bucket{le="64.99999999999999"} 304207
or,
prometheus_engine_query_duration_seconds{slice="inner_eval",quantile="0.5"} 0.000583584
prometheus_engine_query_duration_seconds{slice="inner_eval",quantile="0.9"} 0.000583584
prometheus_engine_query_duration_seconds{slice="inner_eval",quantile="0.99"} 0.000583584
Those are labels. The keys in those pairs are the label name and the values are the label values. For now, for the prometheus metrics that we don't really understand, the labels might not make a lot of sense. Later on when we use it with node exporter it will make a lot more sense.
Metrics scraping
So basically for the one target that the prometheus is monitoring currently, prometheus will get the metrics from the endpoint, localhost:9090/metrics, and store it. How often prometheus scrapes the metrics is determined by the configuration used. So if we go back to the prometheus.yaml file,
global:
  scrape_interval: 15s # Set the scrape interval to every 15 seconds. Default is every 1 minute.
  evaluation_interval: 15s # Evaluate rules every 15 seconds. The default is every 1 minute.
, we can see that prometheus scrapes the metric every 15 seconds.
The graph
One last thing before we finished this post, prometheus helps us to graph our metrics by providing a graph page. It's on the top menu of the prometheus UI.

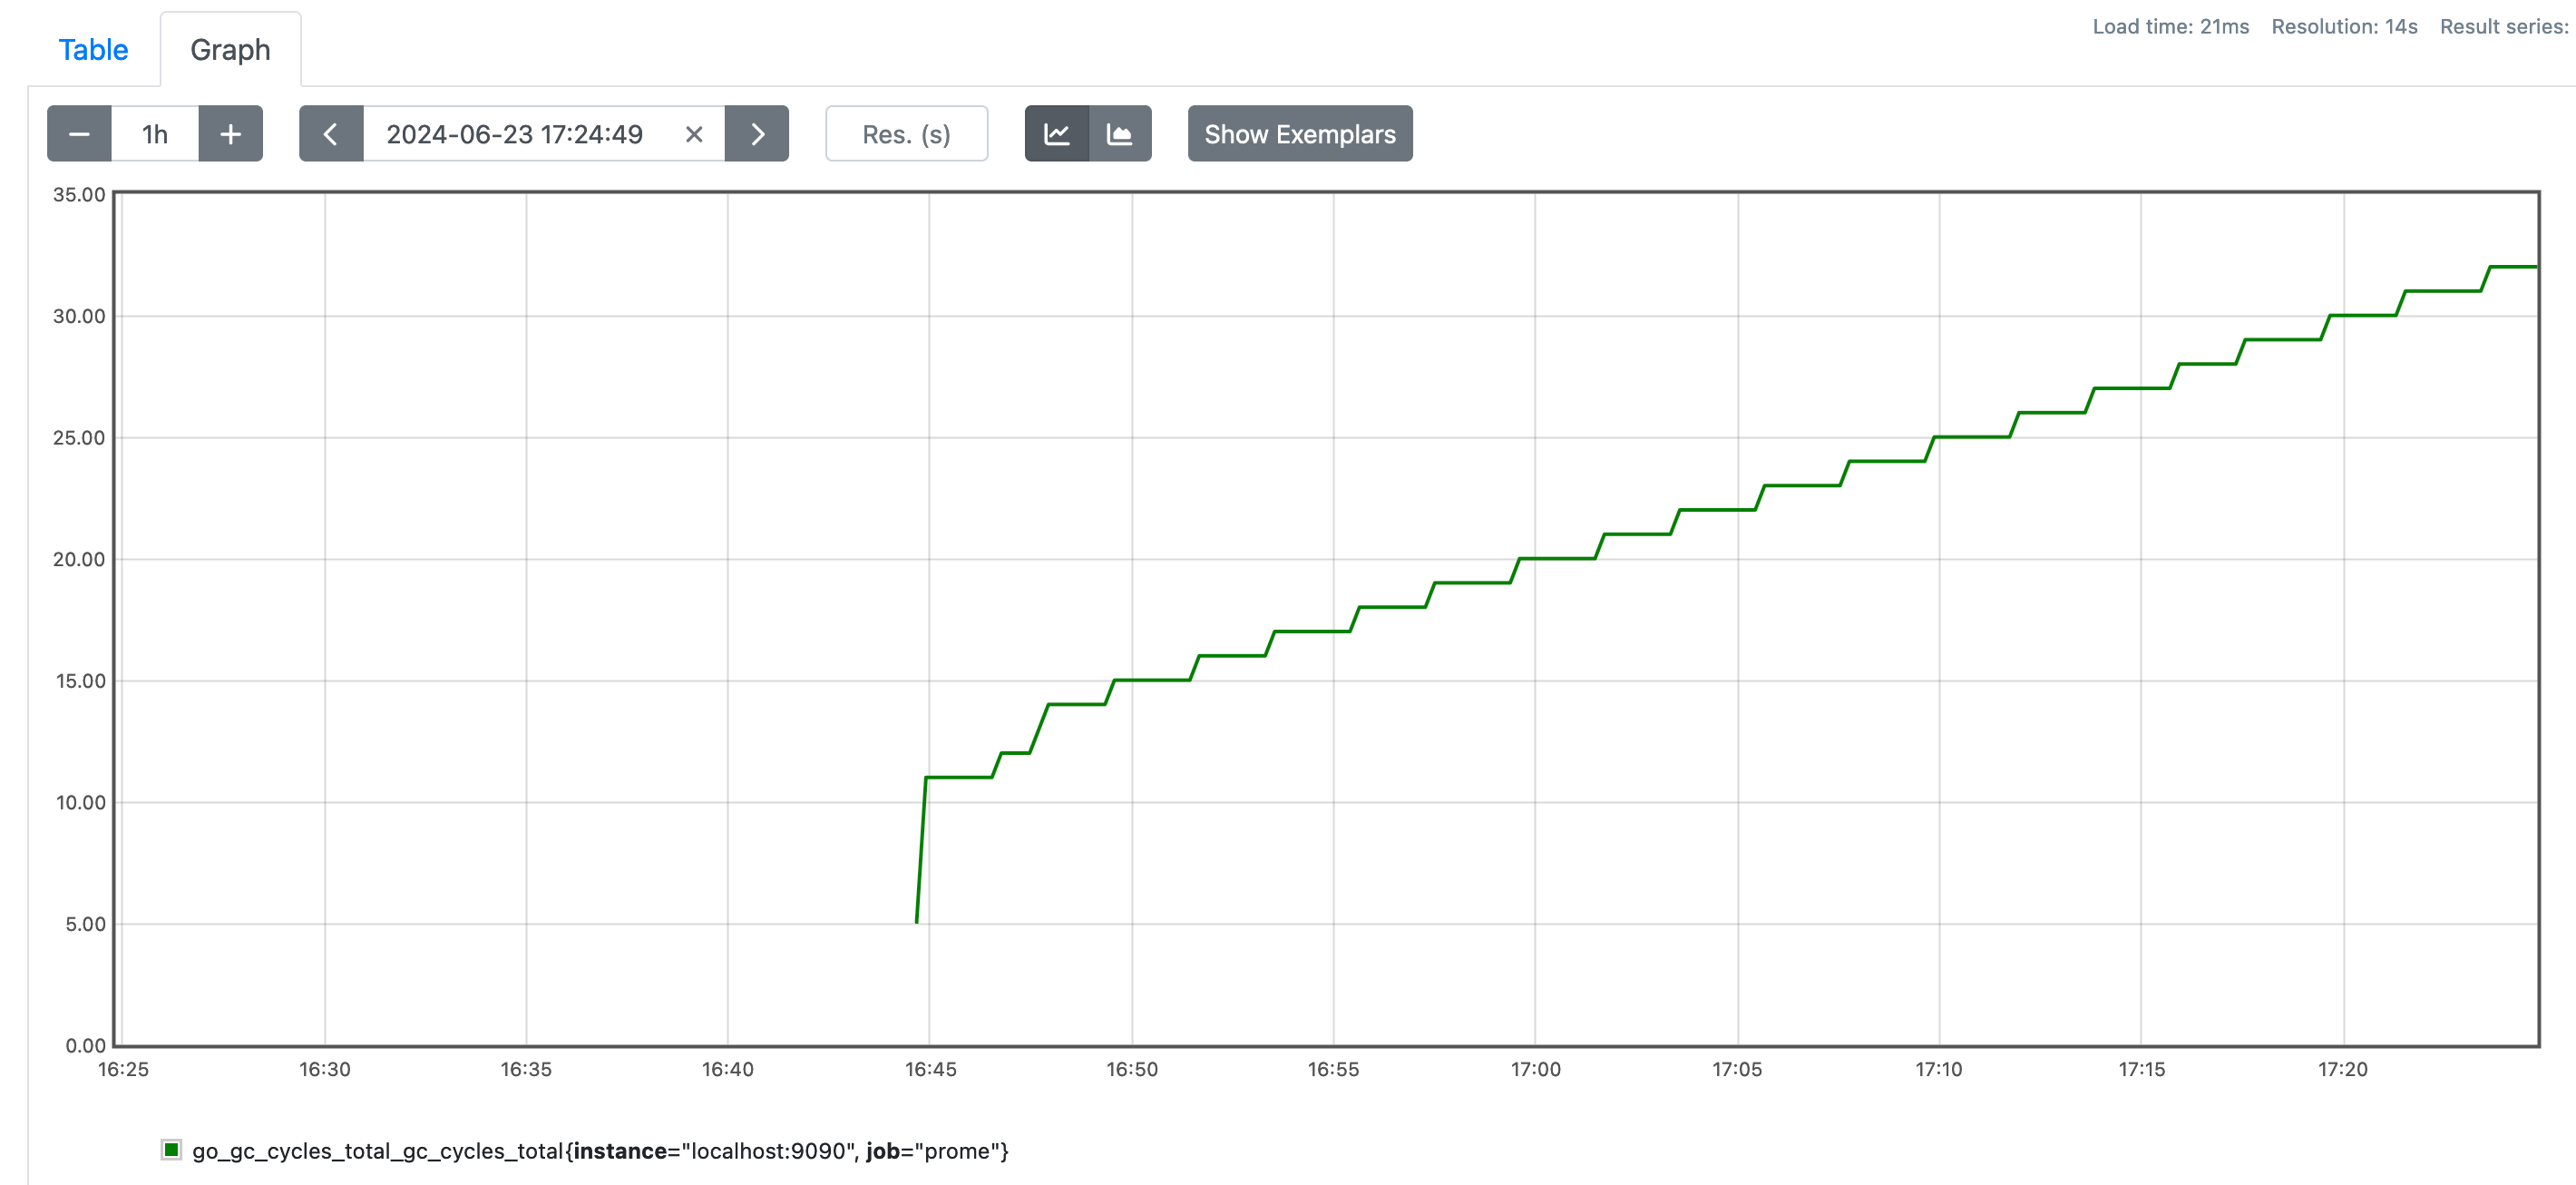
Click Graph and it will open the graph page. On that page, there is a field to input the expression for metrics. Let's type in go_gc_cycles_total_gc_cycles_total. It's one of metrics with type counter. So a counter metrics is a metrics with value that always go up. After you type in the metrics name, click the Execute button. It will show you its current value.

Below the field to type in the expression, there is a Graph tab just at the right side of Table. Click on that and it will show you the graph of the metrics.

Conclusion
In this post, we discuss a little bit about prometheus' metrics and labels. Also we discuss about how to see the graph of a metrics. In the next post, we will use prometheus' node exporter to monitor our local machine's CPU and memory usage.