Prometheus - Getting started
The simplest way to start learning Prometheus is to install it in your laptop and see what it's all about. You can use it as a monitoring tool for your machine. So let's do that.
Download the thing
Go to its download page and find the prometheus section. You will find there the tar.gz file for Linux, Mac, and Windows. Download the one that suits your machine's OS. Mine is Mac so I will download the Darwin file. Just downloaded, now I have prometheus-2.53.0.darwin-amd64.tar.gz file in my machine.
Extract and check the file
Now using command line:
$ tar xzvf prometheus-2.53.0.darwin-amd64.tar.gzThere is a new directory named prometheus-2.53.0.darwin-amd64 in my Downloads directory now. I am moving it to my ~/opt for convenience.
$ mv prometheus-2.53.0.darwin-amd64 ~/opt/prometheusInside ~/opt/prometheus you should have prometheus binary and its config file, prometheus.yml. The important thing to know for now is that to run prometheus we need a configuration file and we are going to use that yaml file as our configuration file.
Run it and browse the metrics
Now from inside ~/opt/prometheus directory run the binary.
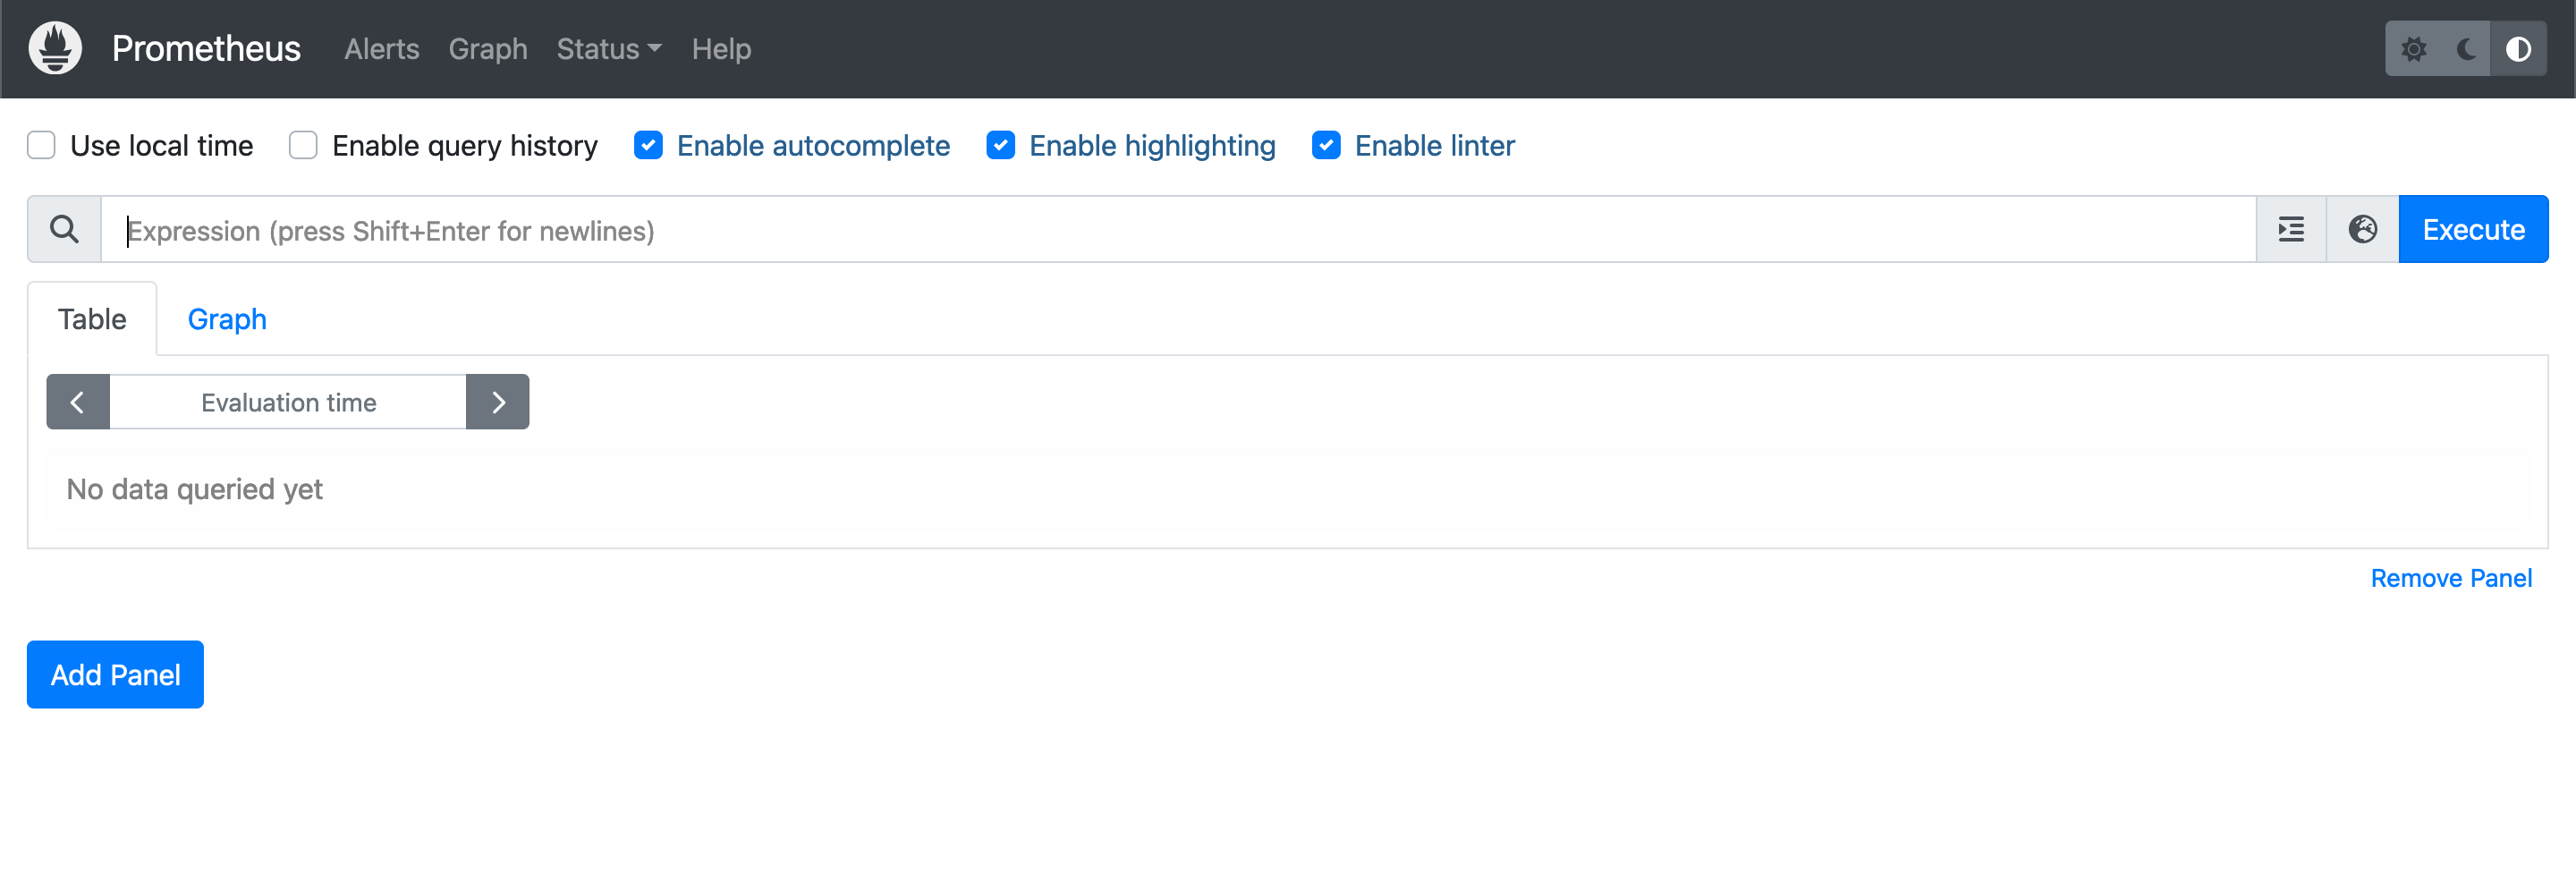
$ ./prometheus --config.file=prometheus.ymlOpen your preferred browser and access http://localhost:9090. You now have prometheus UI in your browser.

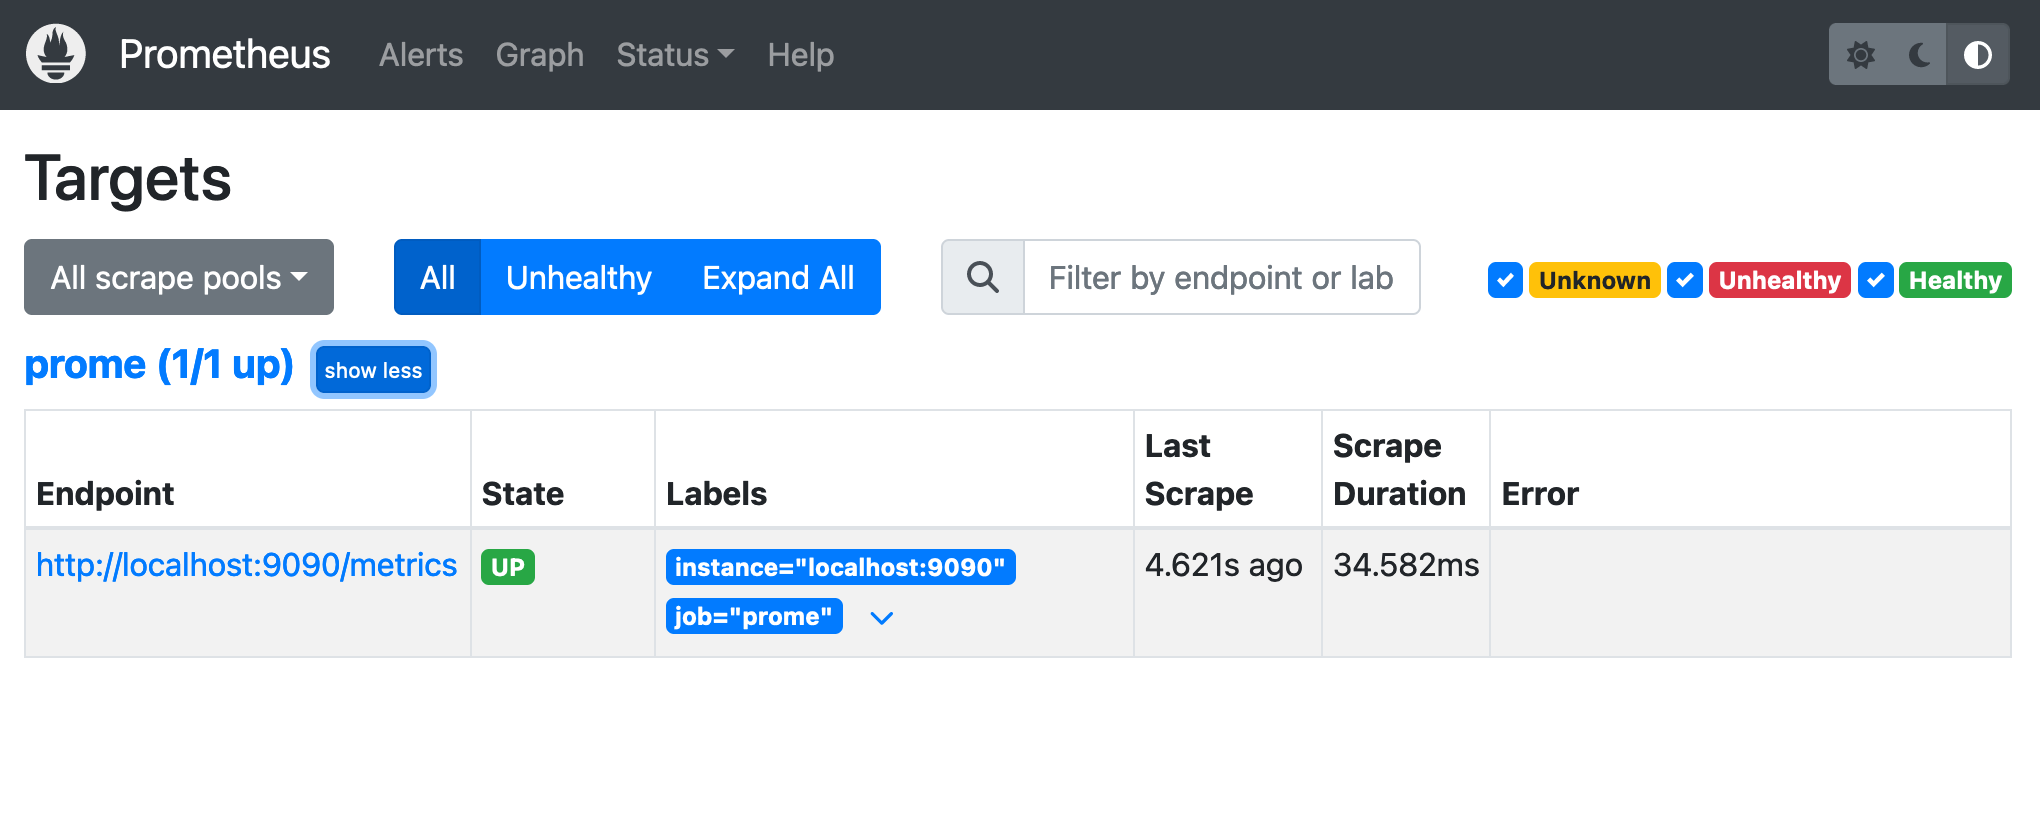
But what metrics are available? Where are they coming from? Check the targets scraped by Prometheus by clicking Status at the top menu and then click Targets.

Config file
To understand why you have 1 target the first time you run prometheus, read the content of prometheus.yml file.
# my global config
global:
  scrape_interval: 15s # Set the scrape interval to every 15 seconds. Default is every 1 minute.
  evaluation_interval: 15s # Evaluate rules every 15 seconds. The default is every 1 minute.
  # scrape_timeout is set to the global default (10s).

# Alertmanager configuration
alerting:
  alertmanagers:
    - static_configs:
        - targets:
          # - alertmanager:9093

# Load rules once and periodically evaluate them according to the global 'evaluation_interval'.
rule_files:
  # - "first_rules.yml"
  # - "second_rules.yml"

# A scrape configuration containing exactly one endpoint to scrape:
# Here it's Prometheus itself.
scrape_configs:
  # The job name is added as a label `job=<job_name>` to any timeseries scraped from this config.
  - job_name: "prometheus"

    # metrics_path defaults to '/metrics'
    # scheme defaults to 'http'.

    static_configs:
      - targets: ["localhost:9090"]
At the top level there are 4 fields: global, alerting, rule_files, and
scrape_configs. Ignore alerting and rule_files for now. If you check the
value alerting, the targets itself is empty. The same with rule_files. And
we don't need them for now.
The values in global are the default value for the rest of configuration when
it applies. Inside scraper_configs there are items, each of them is a scrape
config. Currently we have 1 item in scrape_configs, a scrape config with
prometheus as the job_name. Let's change the value of job_name to prome.
Stop the currently running prometheus in your terminal by pressing Ctrl-C. And
run it back. It will use the updated config file.

Conclusion
We conclude the post for now because it will be too long and too boring to read. In the next post I will write about the metrics provided by prometheus itself. Then after that we will install prometheus' node exporter to monitoring our local machine/laptop/PC.